SURREAL ECONOMICS OR CONCRETE SCIENCE?
It was the best of times, it was the worst of times, it was the age of wisdom, it was the age of foolishness, it was the epoch of belief, it was the epoch of incredulity, it was the season of Light, it was the season of Darkness, it was the spring of hope, it was the winter of despair, we had everything before us, we had nothing before us, we were all going direct to Heaven, we were all going direct the other way—in short, the period was so far like the present period, that some of its noisiest authorities insisted on its being received, for good or for evil, in the superlative degree of comparison only.
Charles Dickens
A Tale of Two Cities
It is fascinating to note that the profound symbolism contained in what many believe to be the greatest novel ever written can be metaphorically applied to the human condition today. The great question facing humanity centers on how to measure its state, progress, and the remaining possible extent of human activities. Are we wisely using the planet's resources and how long can these resources last and thereby human activities be sustained? To answer these questions we need metrics and numbers to know how we're doing and to see where we're going; for how long.
CITY ONE - SURREAL ECONOMICS
Over time the two cities have evolved to provide the metrics to answer these questions. The first city we refer to as the Theories of Surreal Economics. Its primary metric is global GDP and as we can see from the chart below human progress and achievements have been utterly astounding over the past 300 years, and by the way, so has population growth. What could be better?
GLOBAL POPULATION GROWTH
CITY TWO - CONCRETE SCIENCE
Well, the second city we refer to as the Truths of Concrete Science as they use a different set of metrics that present an opposing view of the human condition and the physical state of the planet's resources and what is required to sustain human activities. The key metrics thus work to measure the overall physical climate, resources, and ecology. In other words, the real wealth of the planet and, not the abstract surreal version used by the first city.
Here are some charts that show how we're doing using these concrete metrics.
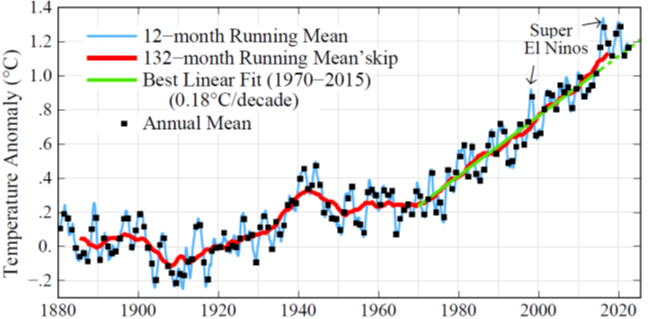
First, here is a recent report from our contact and friend Dr. James Hansen, a world-renowned climate scientist who was the first to testify before the US congress in 1988 and warn the lawmakers about the impending warming of the planet. The chart presented in Table 1 below is deeply disturbing - as it forms a graphical hockey stick similar to the GDP and Population charts above.
This means that there is a high correlation and good chance of causality between GDP/Population growth and global warming. Extending these variables forwards means that we are heading to ever higher temperatures unless immediate actions are taken to either mitigate or somehow reverse this terrible trend.
But climate is not the only concern of the second city. The next is resource consumption and how long before these critical resources are practically exhausted for global economic purposes. Some researchers have targeted the exhaustion date at 2050 based on the current known planetary supplies. We can see from the hockey stick chart below - that just our consumption of critical energy sources over the past 200-plus years also strongly correlates with charts for GDP/Population growth.
These exponential growths in human activity, population, and global warming also adversely affect the other plants and creatures living on the planet which all work together to form the ecology and thereby provide a survivable habitat for humanity. There is also always the possibility that should any small critical link in the ecology be broken, then the whole system could crash into an abyss where unknown, unknowns would prevail.
The hockey stick chart below again shows a correlation that infers increased human activity, GDP, and population growth results in species' extinctions increasing in tandem. We know that they can survive without us - but, can we survive without them?
CONCLUSION:
So there you have it - two different cities with the two views and realities that they assert. One says don't worry everything is fine - be happy. The other says we are rapidly heading into the abyss where we face the unknown, unknowns of dire consequences. It is truly amazing that what Charles Dickens historically wrote in 1859, can also apply symbolically to our world today - however, the biggest difference today is - we are simply running out of time to get it right.
And so it is:
'we had everything before us, we had nothing before us, we were all going direct to Heaven, we were all going direct the other way—in short, the period was so far like the present period, that some of its noisiest authorities insisted on its being received, for good or for evil, in the superlative degree of comparison only.'
- Charles Dickens
|
|
|
|
|


