Has Non-OPEC OIL Production Peaked?

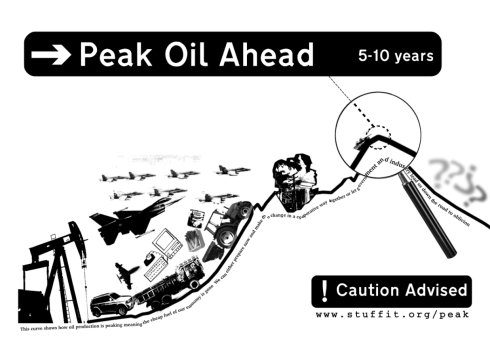
Serious trends. when combined with the OPEC decline starting in December 2016. All this integrates and correlates well with peak discoveries, major well life expectancy (40 years), fracking as a short term bandage and Hubbard's curve. We are now about ten years past expected global peak oil - or are we?
Be careful out there !
United States C+C production peaked in April at 9,694,000 bpd and has dropped half a million barrels per day by December to 9,191,000 bpd.

Here is a 2 year chart of US production that gives an amplified look at what is happening. November and December production is now below November 2014 production.

Non-OPEC C+C peaked in December at 47,207,000 bpd and dropped 763,000 bpd to 46,444,000 bpd by October. The above chart, I believe, clearly shows that Non-OPEC production is in a downward trend. There is little doubt that this trend will continue for the next year or so. The question is how far will it drop before an increase in prices brings back enough upstream investment to turn production back around? And how long will that take?

World C+C production peaked in July at 80,531,000 and by October had dropped 461,000 bpd to
Serious trends. when combined with the OPEC decline starting in December 2016. All this integrates and correlates well with peak discoveries, major well life expectancy (40 years), fracking as a short term bandage and Hubbard's curve. We are now about ten years past expected global peak oil - or are we?
Be careful out there !
First Financial Insights
Here is a 2 year chart of US production that gives an amplified look at what is happening. November and December production is now below November 2014 production.
Non-OPEC C+C peaked in December at 47,207,000 bpd and dropped 763,000 bpd to 46,444,000 bpd by October. The above chart, I believe, clearly shows that Non-OPEC production is in a downward trend. There is little doubt that this trend will continue for the next year or so. The question is how far will it drop before an increase in prices brings back enough upstream investment to turn production back around? And how long will that take?